
Inserting Objects
This section covers adding objects to a slide through the TurningPoint ribbon.
Correct Answer Indicator
A correct answer indicator allows participants to see the correct answer or answers after polling is closed. The indicator appears during a presentation when the slide is advanced after displaying the chart.
IMPORTANT: A correct answer must be set before a correct answer indicator can be inserted on a polling slide.
1. Select the polling slide.
2. From the TurningPoint Cloud ribbon click the shapes icon  , mouse over Correct Answer Indicator and select the desired indicator.
NOTE: There are seven types of correct answer indicators available.
Inserting a Chart/Changing the Chart Type
A chart displays the results of participant responses. The default chart type and display options, such as labels and value, can be defined in the Preferences.
To make a PowerPoint slide interactive, a TurningPoint chart must be added to the slide. Assuming that the PowerPoint slide is in Title and Content form, a chart can be added by following the steps below.
1. Select the polling slide.
TIP Select more than one slide by holding down the Ctrl or Shift key on the keyboard.
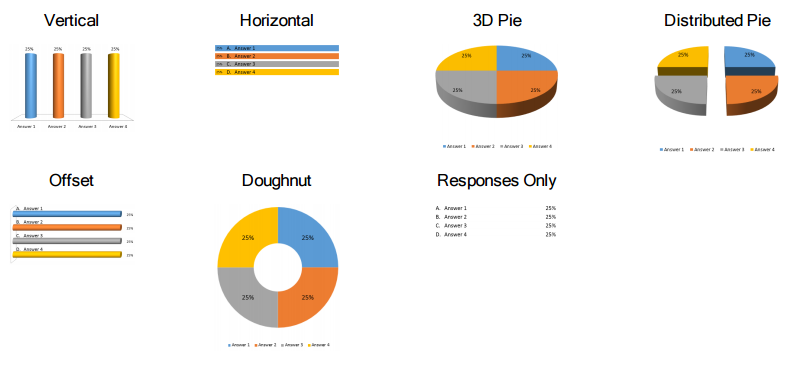
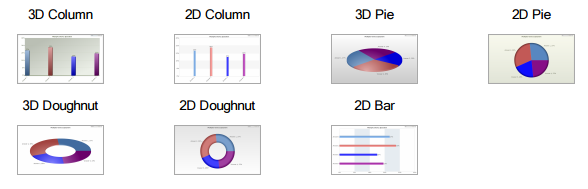
2. From the TurningPoint Cloud ribbon click the shapes icon , mouse over Charts and select the desired chart.
There are seven chart types available.
NOTE:
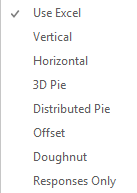
- To change the current chart on the slide, select a different chart from the Objects menu.
- To insert a Graph chart or to change the current chart on the slide to a Graph chart, uncheck Use Excel from the Objects menu.
- Click the shapes icon , mouse over Charts and select the desired chart. The colors of Graph charts can be edited from the Slide Preference Pane.
- The colors of Excel charts can be edited from PowerPoint Chart Tools.
- To remove the chart, simply delete the object from the slide.
Inserting an Animated Chart
An animated chart is a flash object that appears over the Slide Show in full screen.
Adobe Flash Player must be installed to use the animated charts. Go to http://get.adobe.com/flashplayer to download the latest version of Adobe Flash Player. An animated chart can be added by following the steps below.
1. Select the polling slide.
2. From the TurningPoint ribbon click the shapes icon , mouse over Animated Charts and select the desired chart.
3. A placeholder is then inserted for the animated chart.
There are seven animated chart types available.
NOTE:
- To change the current chart on the slide, select a different chart from the Objects menu. The chart can also be changed during the Slide Show by selecting a different chart type from the drop-down menu on the chart window.
- To remove the animated chart, simply delete the placeholder from the slide.
Inserting a Countdown Timer
A countdown timer provides participants with a visual cue that polling is about to close as it counts down to zero. When the countdown expires, the countdown timer disappears and polling is automatically closed. A countdown timer can be made to appear on each polling slide that is created.
1. Select the polling slide.
TIP: Select more than one slide by holding down the Ctrl or Shift key on the keyboard.
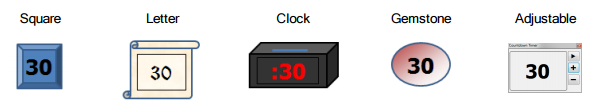
2. From the TurningPoint ribbon click , mouse over Countdown and select the desired countdown timer.
There are five countdown timers available.
NOTE:
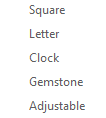
- The Adjustable countdown timer inserts a placeholder icon
 on the slide. During the slideshow it displays as above.
- To change the current countdown on the slide, select a different countdown from the Objects menu.
- To remove the countdown, simply delete the object from the slide.
3. To adjust the time or add a sound to the countdown timer, click the countdown timer.
Adjust the time from the Slide Preferences Pane.
a. To adjust the time, enter a value into the Countdown Seconds box. A valid entry is 1 - 999.
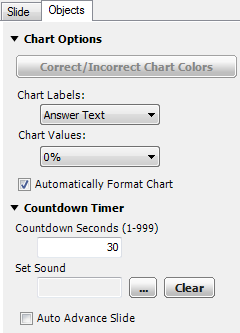
b. To add a sound, click the more icon  , browse to the location of the sound file, and click Open.
If you have any questions or need further assistance, please contact the Faculty Technology Center at (225) 578-3375, option 2 or email ftc@lsu.edu.